![Logo - Secondary White-1.png]](https://help.askcody.com/hs-fs/hubfs/Logo%20-%20Secondary%20White-1.png?height=50&name=Logo%20-%20Secondary%20White-1.png)
What is Services Insights?
Services Insights gives you a complete overview of how your organization uses service resources and providers. It helps you understand how employees place and cancel service requests, how providers respond, and how activity changes over time. You can also explore which items are most requested from each provider to uncover trends and preferences across your workplace.
Data is updated weekly and can be viewed for up to the last 13 months. You can filter by time period, weekday, or service provider, and export the data for deeper analysis.
Understanding the dashboard
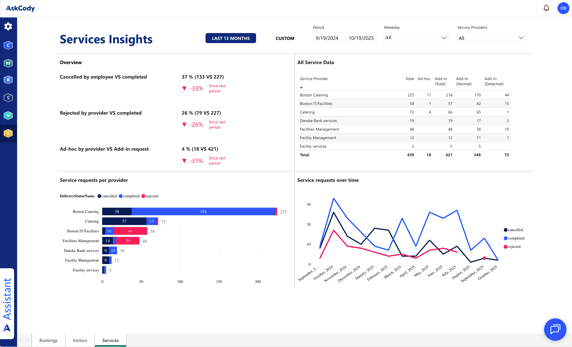
The Services Insights dashboard is structured into three main parts:
Overview metrics
At the top of the dashboard, you’ll see three key indicators that summarize overall service activity:
-
Cancelled by Employee vs. Completed
Are employees cancelling a lot of requests themselves? This might mean employees are changing meeting needs frequently or booking services too early, only to realize they won't need them -
Rejected by Provider vs. Completed
Are providers rejecting many of the requests they receive? This could happen if employees request something they shouldn’t, or if providers simply don’t have inventory available -
Ad-hoc by Provider vs. Add-in Request
How many requests are placed directly with the provider (ad-hoc), and how many are linked to meetings via the Outlook add-in? Do you want everyone to use the add-in so requests are always tied to meetings, or are you aiming for a different process?
Detailed service data
This section gives you deeper insights into provider performance and usage:
-
All service data
Gives an overview of how many requests each provider has handled and how they are distributed between ad-hoc and add-in requests. You can use this to assess activity levels and understand where processes can be improved.
Questions for analysis:-
What is the employee-to-request ratio?
-
Are there complaints about certain providers not being available?
-
How many requests are being detached from meetings?
-
-
Service requests per provider
Quickly compare cancellations, completions, and rejections across providers. This helps highlight which providers are reliable and where issues occur.
Questions for analysis:-
Which providers deliver consistently?
-
Are some providers rejecting more requests than others?
-
Is there a pattern in cancellations tied to specific providers?
-
-
Service requests over time
See how busy providers have been historically. Can you spot seasonal spikes or recurring peaks? Do you need to allocate more staff during certain periods?
Questions for analysis:-
When are services most in demand?
-
Do certain times of year require extra staff or resources?
-
Are there predictable dips where resources could be reallocated?
-
- Item requests per provider

Displays insights about the items employees request from one, several, or all service providers. You can see which items are most popular, how demand changes over time, and whether certain items or categories show seasonal trends.
Questions for analysis:
-
Which items are requested most often?
-
Are there recurring patterns or seasonal preferences?
-
Does item demand vary between providers?
-
How to use these Insights
Services Insights is not just about tracking numbers, it’s about enabling better decisions. You can use this data to:
-
Enforce policies
Ensure employees place requests via the Outlook add-in, so services always follow meetings. -
Improve service quality
Identify providers with high rejection rates and work with them to address the issues. -
Plan resources
Use activity and item data to prepare providers for busy periods and optimize staffing. -
Improve employee experience
Reduce cancellations and rejections so employees get what they need for their meetings without friction. - Understand demand trends
Use item-level insights to refine menus, adjust inventory, and tailor offerings to real needs.